Jack Lovell

Interactive Genomic Data Visualization

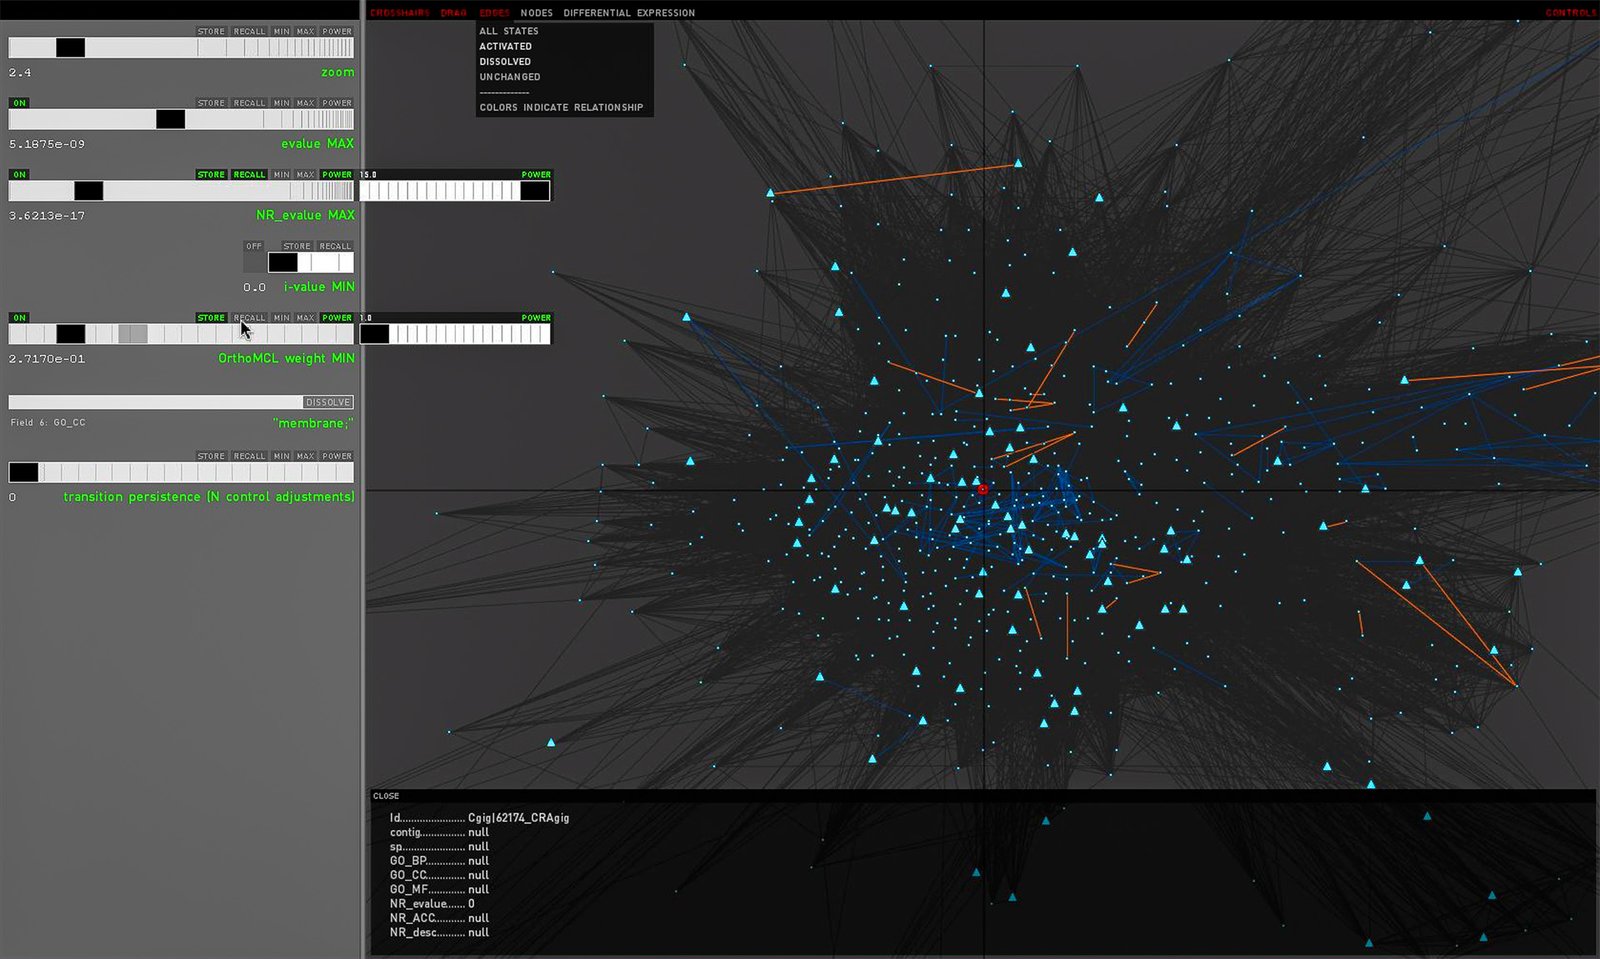
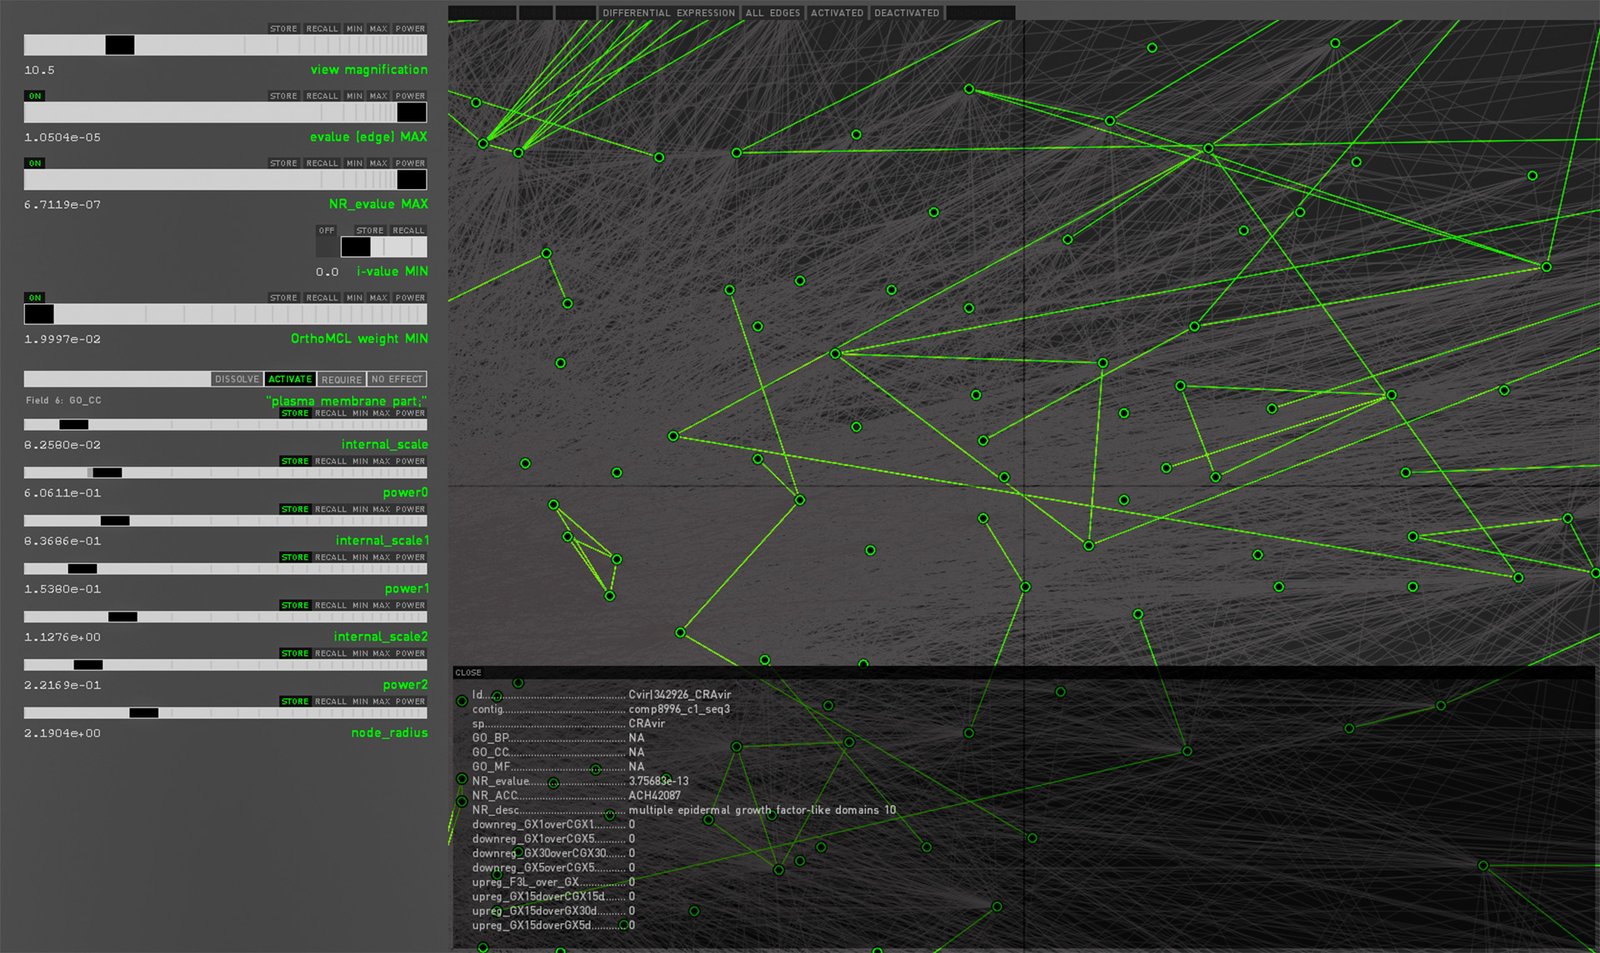
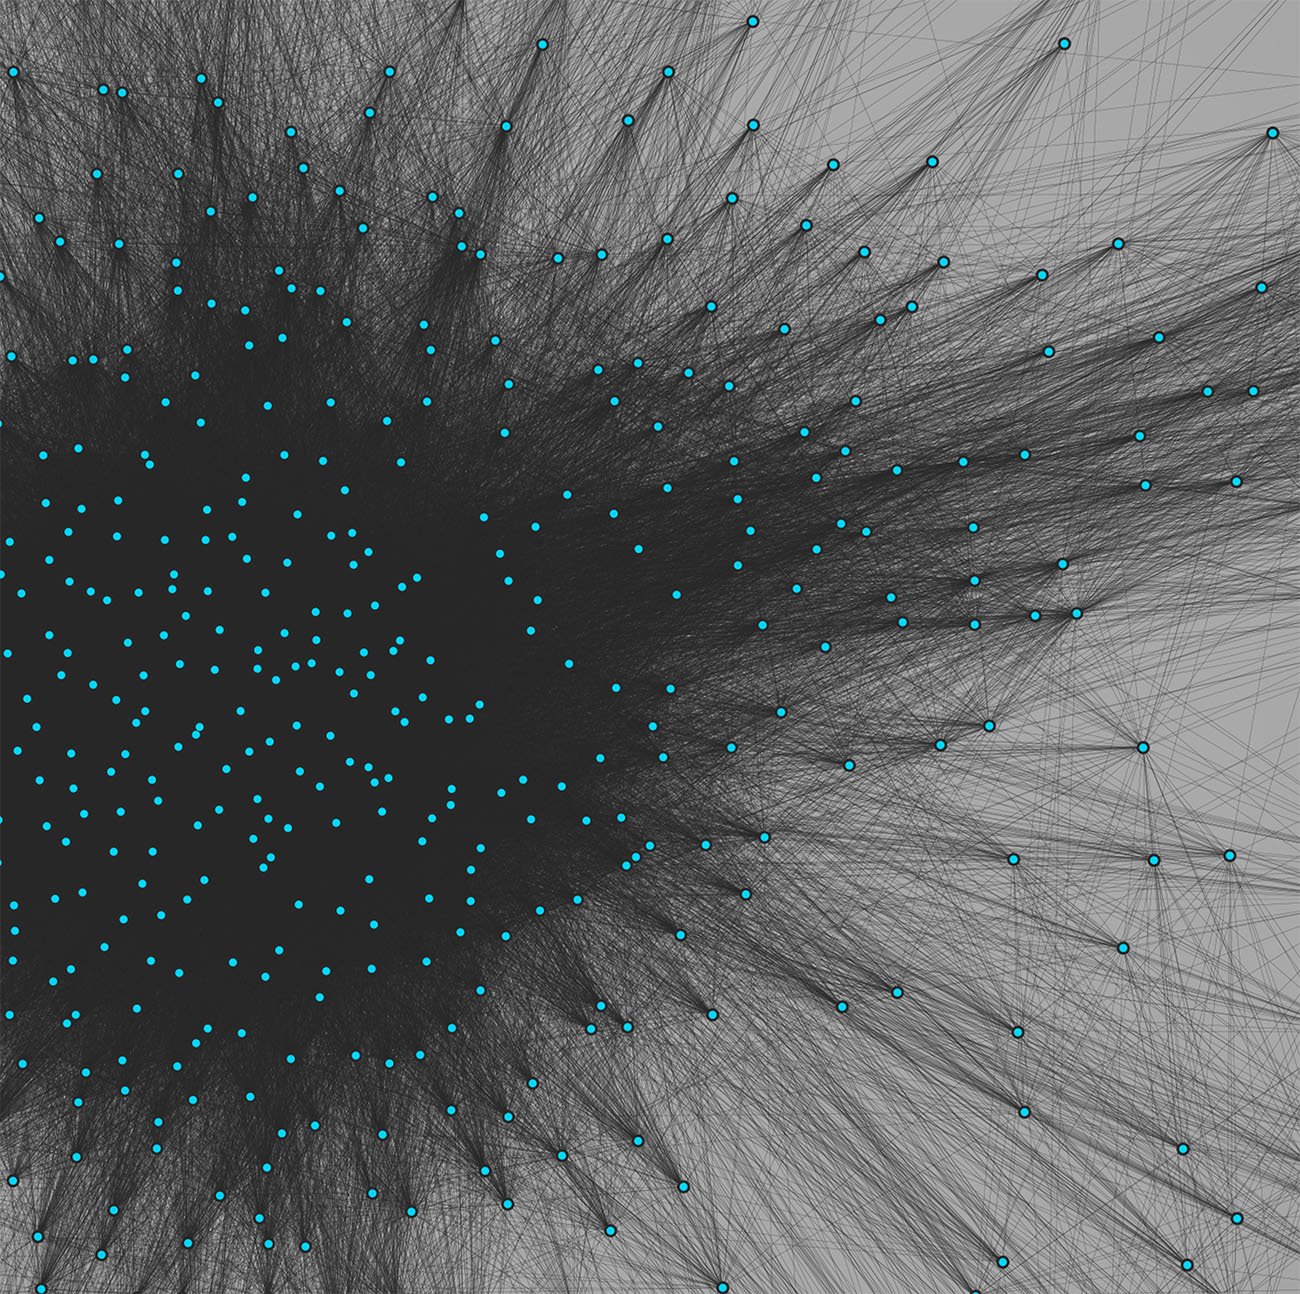
I collaborated with geneticists to design and develop an interactive visualization tool that helps researchers explore and analyze genomic data of oysters affected by bacterial pathogens. The tool features a network of 50,000+ nodes, enabling users to isolate and filter genetic markers related to bacterial resistance.

I was responsible for the graphic design, interaction design, and coding of the tool. Using Cytoscape to process raw data, I programmed an interface that allows intuitive data exploration with interactive controls, helping researchers visually identify patterns in the genomic data.

This project was presented at a genetic data visualization conference and contributed to a scientific paper published in the Journal of Shellfish Research.